[This post is by Eric Chu, Android Developer Ecosystem. —Dirk Dougherty]
On the Android Market team, it’s been our goal to bring you improved ways of seeing and understanding the installation performance of your published applications. We know that this information is critical in helping you tune your development and marketing efforts. Today I’m pleased to let you know about an important new feature that we’ve added to Android Market called Application Statistics.
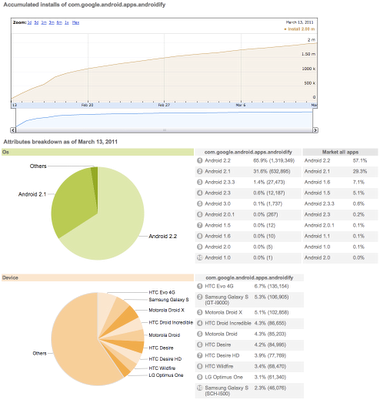
Application Statistics is a new type of dashboard in the Market Developer Console that gives you an overview of the installation performance of your apps. It provides charts and tables that summarize each app’s active installation trend over time, as well as its distribution across key dimensions such as Android platform versions, devices, user countries, and user languages. For additional context, the dashboard also shows the comparable aggregate distribution for all app installs from Android Market (numbering in the billions). You could use this data to observe how your app performs relative to the rest of Market or decide what to develop next.

To start with, we’ve seeded the application Statistics dashboards with data going back to December 22, 2010. Going forward, we’ll be updating the data daily.
We encourage you to check out these new dashboards and we hope they’ll give you new and useful insights into your apps’ installation performance. You can access the Statistics dashboards from the main Listings page in the Developer Console.
Watch for more announcements soon. We are continuing to work hard to deliver more reporting features to help you manage your products successfully on Android Market.